

In this third and last part of my interview with John Beaudoin, we’re looking at CDC’s data for acute kidney or renal failure deaths from 2018 until 2025.
For years, Beaudoin has been sounding the alarm about a staggering increase in acute kidney failure deaths beginning in 2020 - but he got little traction. One reason is that these deaths are not apparent when researchers exclusively use Underlying Cause of Death (UCoD) in their analysis of CDC’s mortality data.
Underlying Cause of Death Versus Multiple Cause of Death
As Beaudoin explained in an earlier part of the interview, UCoD is not a useful measure for uncovering causes of death because of insufficient data integrity: doctors often do not fill in the underlying cause of death on the designated line of the death certificate. Beaudoin knows this because he got access via a FOIA request to a huge number of death certificates, mainly for Massachusetts.
That’s why he’s been using Multiple Cause of Death (MCoD) in his death analyses. MCoD means that the disease or medical event is listed somewhere on the death certificate but not necessarily on the line dedicated to ‘Underlying Cause of Death.’
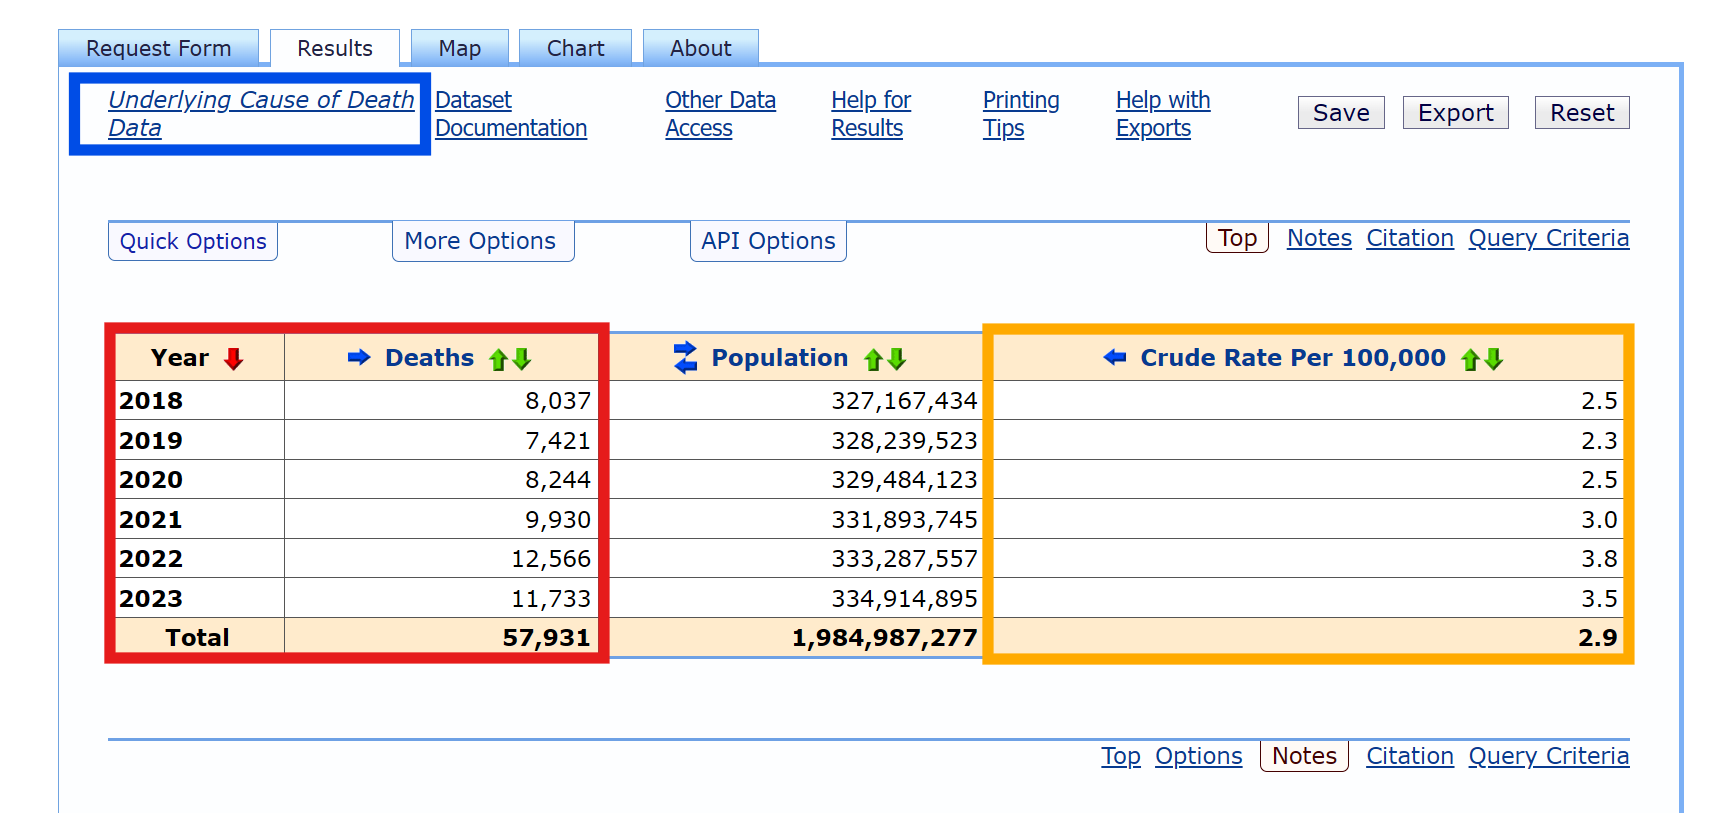
To see the enormous difference for yourself, have a look at the two tables below: one shows acute renal failure deaths from 2018 to 2025 by UCoD (Underlying Cause of Death). The other one shows the same but by MCoD (Multiple Causes of Death).
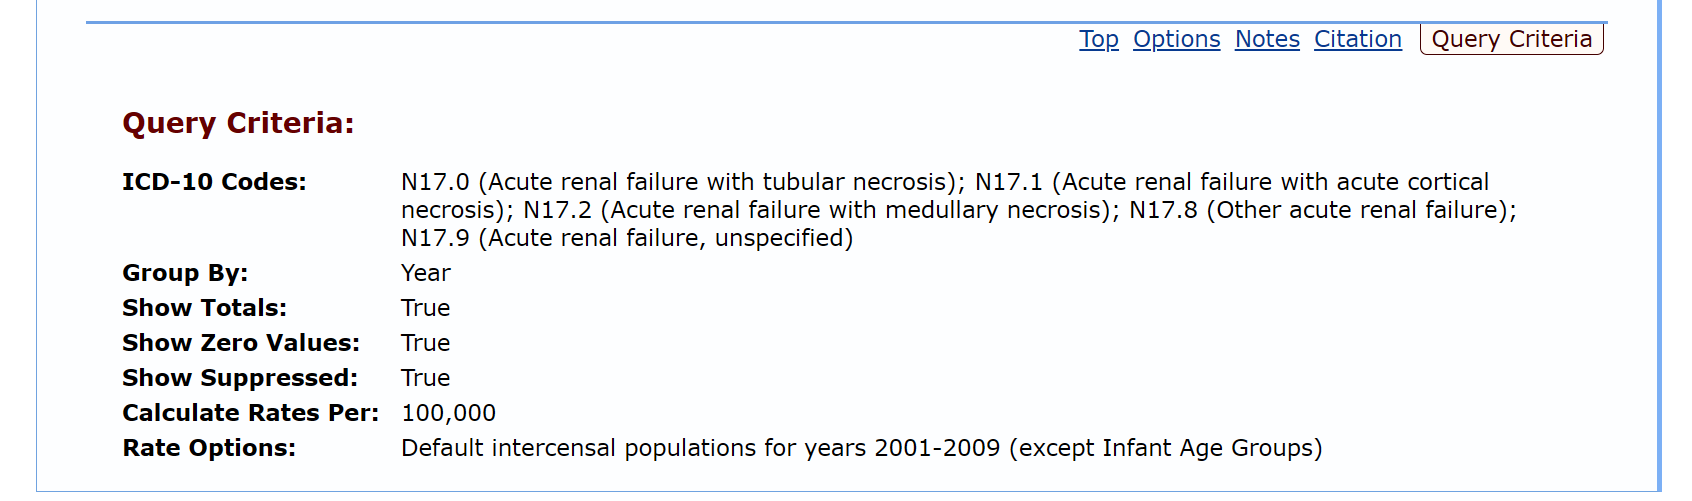
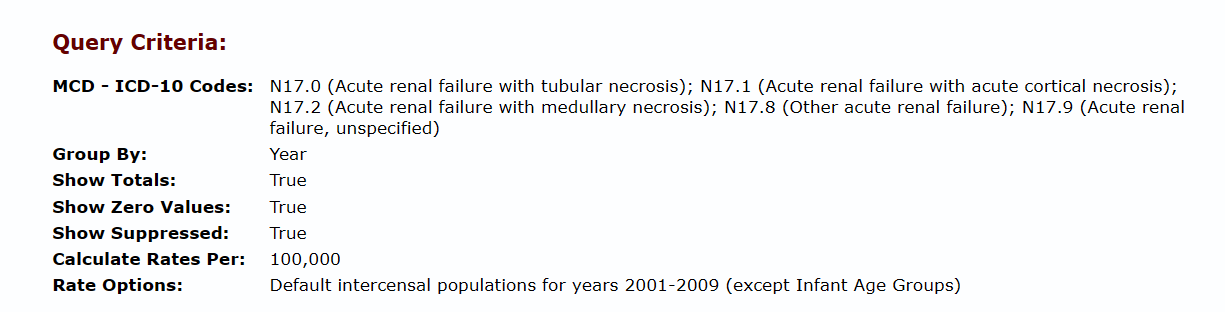
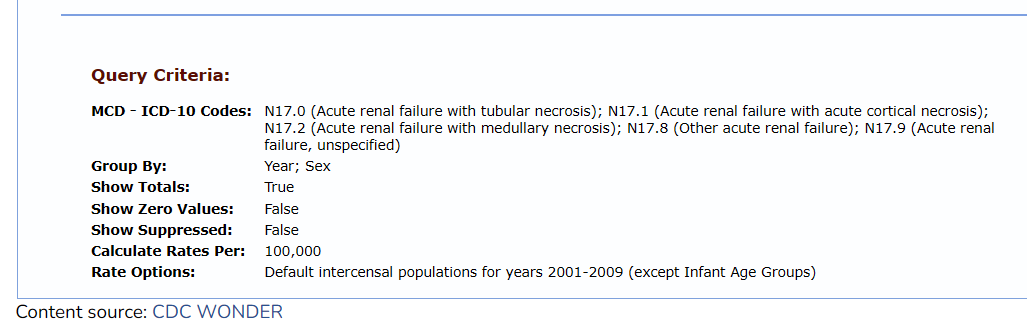
Query criteria are listed below each table.
Acute Renal Failure Deaths by UCoD and MCoD 2018-2023
The table below shows deaths by Uncerlying Cause of Death:
And here is the table showing acute kidney failure deaths according to Multiple Cause of Death:
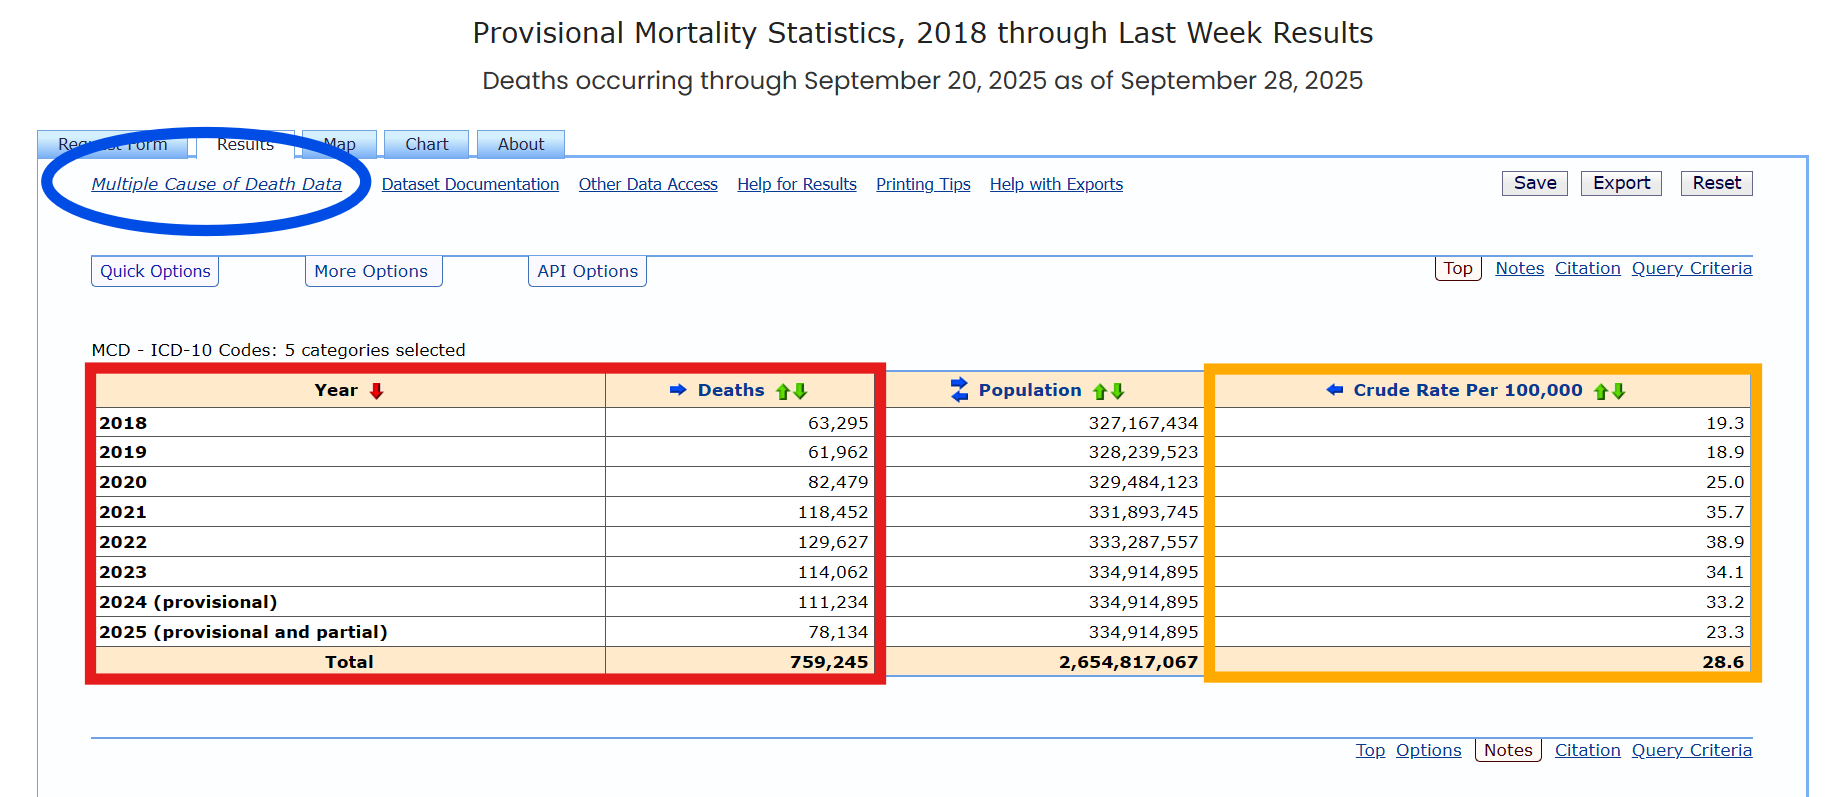
As you can see, the UCoD acute renal failure deaths from 2018 to 2023 add up to about 60,000 whereas the MCoD acute renal failure deaths during the same years add up to ~571,000, almost 10 times as many.
Increase in Acute Renal Failure Deaths 2018-2023
Now let’s look at the increase in acute renal failure deaths year over year for Underlying and Multiple Cause of Death, from 2018 to 2023:
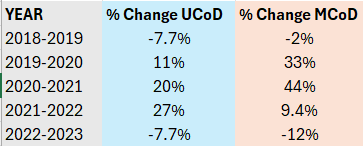
For MCoD deaths we see a 33% increase between 2019 and 2020 and an 11% increase for UCoD deaths.
Many if not most of these additional deaths are very likely caused by the hospital protocols, in particular Remdesivir which is known to cause kidney damage and kidney failure. But ventilators also significantly increase the risk of acute kidney failure: about 39% of mechanically ventilated patients develop kidney injury.1
109% Increase in Acute Renal Failure Deaths by MCoD from 2019 to 2022
In 2021, the number surged to 118,000 for MCoD deaths, a 44% increase from 2020 and a whopping 91% increase from 2019, the last pre-pandemic year.
For UCoD deaths, we see an increase of 20% from 2020 and an increase of 34% from 2019.
Interesting is that from 2021 to 2022 there is an even higher increase in UCoD acute renal failure deaths (27%) compared to the year before whereas the MCoD deaths show a significantly smaller increase (9.4%).
How to explain these additional increases from 2020 to 2021 and from 2021 to 2022? Are these acute kidney failure deaths caused by the Covid shots? Or are they a mixture of a further increase in hospital induced deaths and Covid shot deaths?
And why do both UCoD and MCoD deaths decrease by not much between 2022 to 2023 and by even less between 2023 and 2024? They still remain close to twice the number of baseline year 2019.
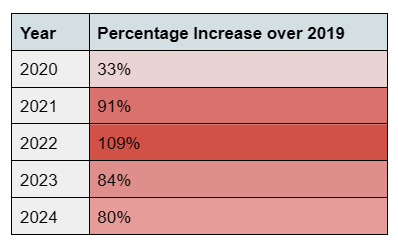
Increase in MCoD Acute Renal Failure Deaths over 2019
The table below shows the percentage increase in MCoD acute renal failure deaths over the 2019 baseline.
As you can see, deaths remain way higher compared to baseline 2019 and decrease only slowly from the peak in 2022.
Did the NIH Research this Staggering & Sustained Increase in Renal Failure Deaths During and Post-Pandemic?
It did, but blamed the additional deaths on Covid-19.
According to Beaudoin, the “NIH funded a bunch of research papers to show that COVID causes this. So they’re coming out with research papers to blame it on COVID because they killed people with the protocols that they use for COVID. And they’re trying to cover it up by saying COVID caused it… But it wasn’t COVID that caused the kidney failure. It was the treatment plan they used for COVID.”
Based on CDC’s mortality data, Beaudoin estimates that there have been over 250,000 acute renal failure excess deaths in the United States since 2020 and not only among older people but among people across all ages:
“If you look at the age groups, you’ll find that this isn’t just old people. These people are dying down into the teens with acute renal failure. And if you multiply it by the number of life-years lost, what I mean is if you die at 20 and you should have died at 75, you lost 55 years of life. But if you die at 81, well, how much life did you lose? What would you have lived to? 82.
So there’s a lot more life years lost with younger people. If you do that calculation of life years lost, what you have is the biggest loss of life years in the last century, except for World War II.”
Increase in Acute Renal Failure Deaths from 2000-2019
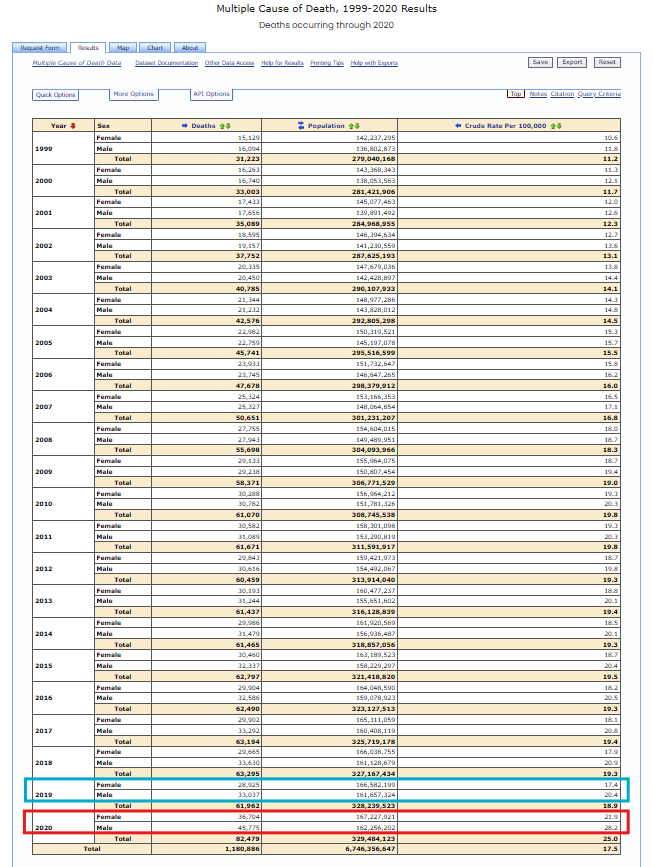
In order to put the increase of acute renal failure deaths during and post-Pandemic into a larger context, I ran a query in CDC Wonder for acute renal failure deaths (ICD-10 code N17) for the years 2000 to 2019 and subcategorized the data by sex.
As you can see in the table below, the increase in acute renal failure deaths from 2019 to 2020 is very large for both men and women.
What’s also interesting here is the following:
From 1999-2010, both male and female acute renal failure deaths increased more or less evenly every single year.
The crude rate per 100,000 during that time rose about 11 per 100,000 in 1999 to about 19 per 100,000 in 2010.
However, from 2010 to 2020 something remarkable happens: Acute renal failure deaths in men keep climbing from about 30,000 in 2010 to about 33,000 in 2019 white acute renal failure deaths in women stop increasing and even fall to 29,000 in 2019.
Even in the year 2020, when we see the explosion of acute renal deaths for both men and women, the noticeable difference in deaths between males and females remains and even increases.
The crude death rate per 100,000 in 2019 for men is 20 and for women 17. In 2020, the first year of Covid-19, the crude rate for men jumps to 28 and for women to almost 22.
https://pmc.ncbi.nlm.nih.gov/articles/PMC6165693/
CHAPTERS
0:00:05 Why Acute Renal Failure Matters Now
0:00:31 Death Certificates: Underlying vs Multiple Causes
0:01:25 Acute Renal Failure Deaths 2018–2025: The Spike
0:03:14 Excess Deaths and Life-Years Lost
0:07:20 Renal Failure vs Myocarditis: What’s Bigger?
0:09:12 Young People and Acute Renal Failure
0:10:36 20-Year Trends and the Male–Female Split
0:14:22 What Could Be Driving the Renal Failure Surge?
0:17:28 Are Recording Practices Skewing the Data?
0:20:43 What This Data Can — and Cannot — Tell Us
RESOURCES
John Beaudoin: HHS Ignores 280,000 Excess Acute Kidney Injury Deaths Despite Covid-19 Ending Four Years Ago
John Beaudoin’s Substack: The Real CdC’s Newsletter
First Part of my Interview with Beaudoin: The Code That Doesn’t Exist: How CDC Disappears COVID Vaccine Deaths
Second Part of my Interview with Beaudoin: Deadly Hospital Protocols Caused Almost 20% Excess Deaths in 2020
